Many grocers and CPG companies are struggling to keep up with changing consumer preferences in the shopping and consumption of food. In the past, grocers didn’t have to prioritize driving traffic because shoppers didn’t have many other options. Yet with the explosion of new products, services and grocery entrants, it has become increasingly difficult for grocers to drive traffic to stores, to drive sales of higher margin center aisle products, and to build loyalty.
Our latest infographic covers struggles and opportunities in the grocery market in recent years:
- Major CPGs are also facing stalling growth: The top 25 food & beverage companies in the US drove only 3% of category growth in 2015.
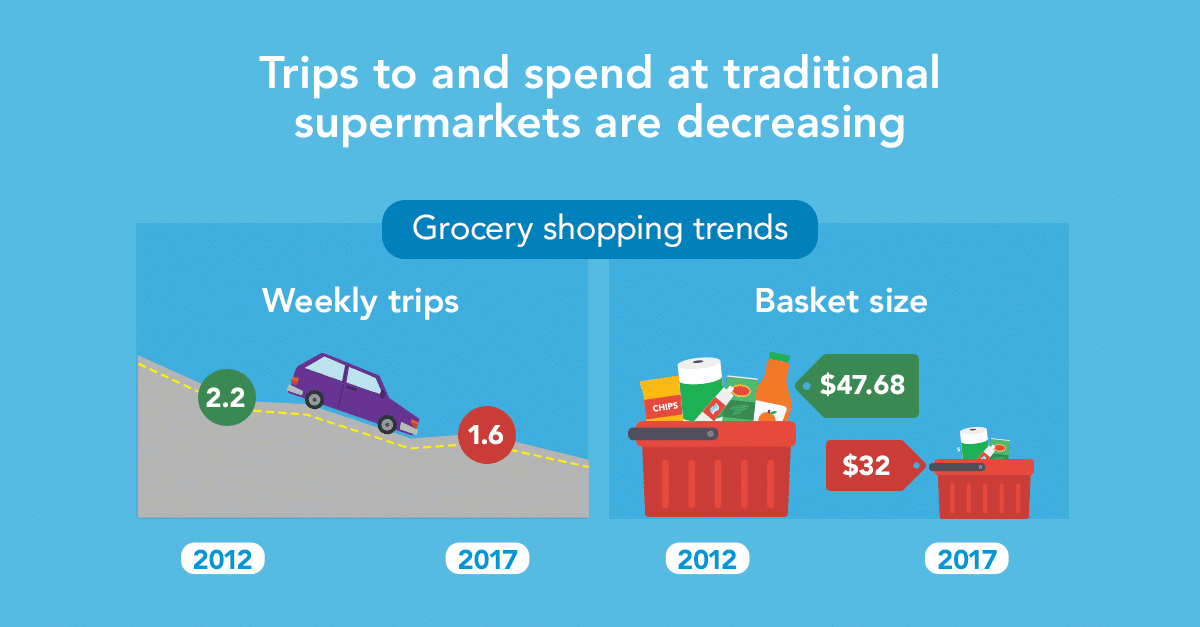
- Trips to and spend at traditional super markets is decreasing: In the past 5 years, shoppers made 27% less trips per week and spent 33% less.
- Traditional engagement drivers aren’t working like they used to: Retailers saw a 13% annual decrease in 2016 in coupon redemption.
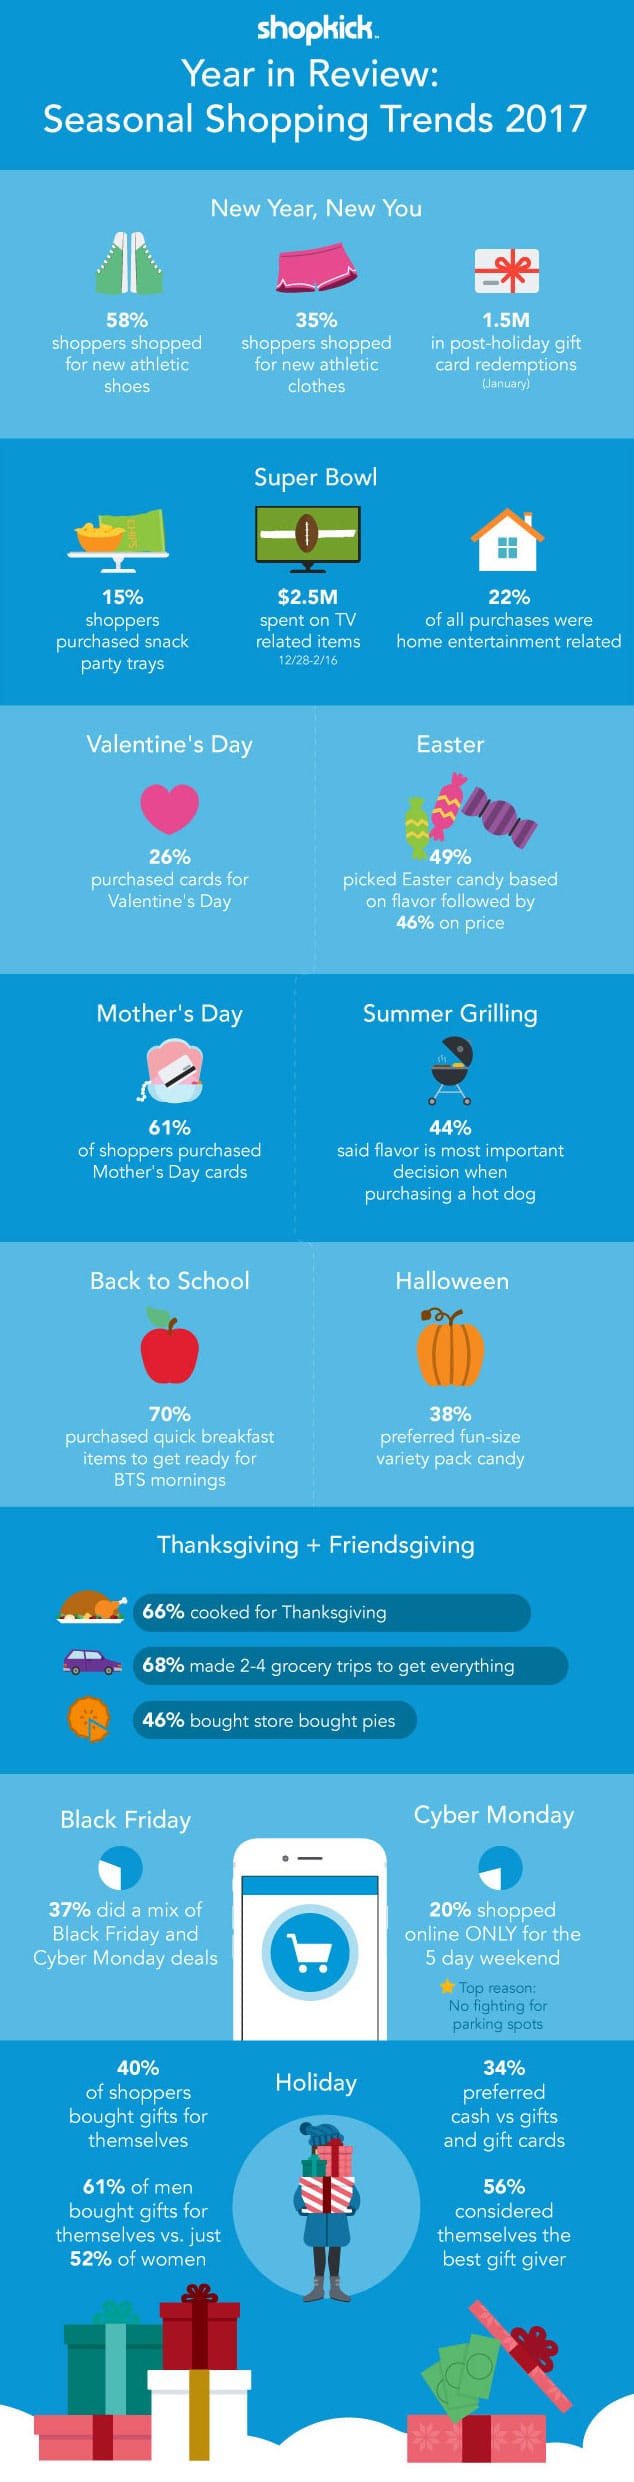
Get the facts about the changing grocery environment, and how fun and engaging shopping experiences can drive store visits, product sales and loyalty in our latest infographic.

![[Infographic]: Seasonal Shopping Trends 2017](https://www.shopkick.com/wp-content/uploads/2017/08/alcohol-advertising.jpg)