CPG retail analytics provides valuable insight into consumer purchase behavior. In the past, the data necessary for this analysis was only available to consumer packaged goods brands from retailers well after a purchase was made. This often resulted in an expensive delay between the implementation of a marketing strategy and determining how effective that strategy was for bolstering sales—and whether or not it should be continued, adjusted, or abandoned.
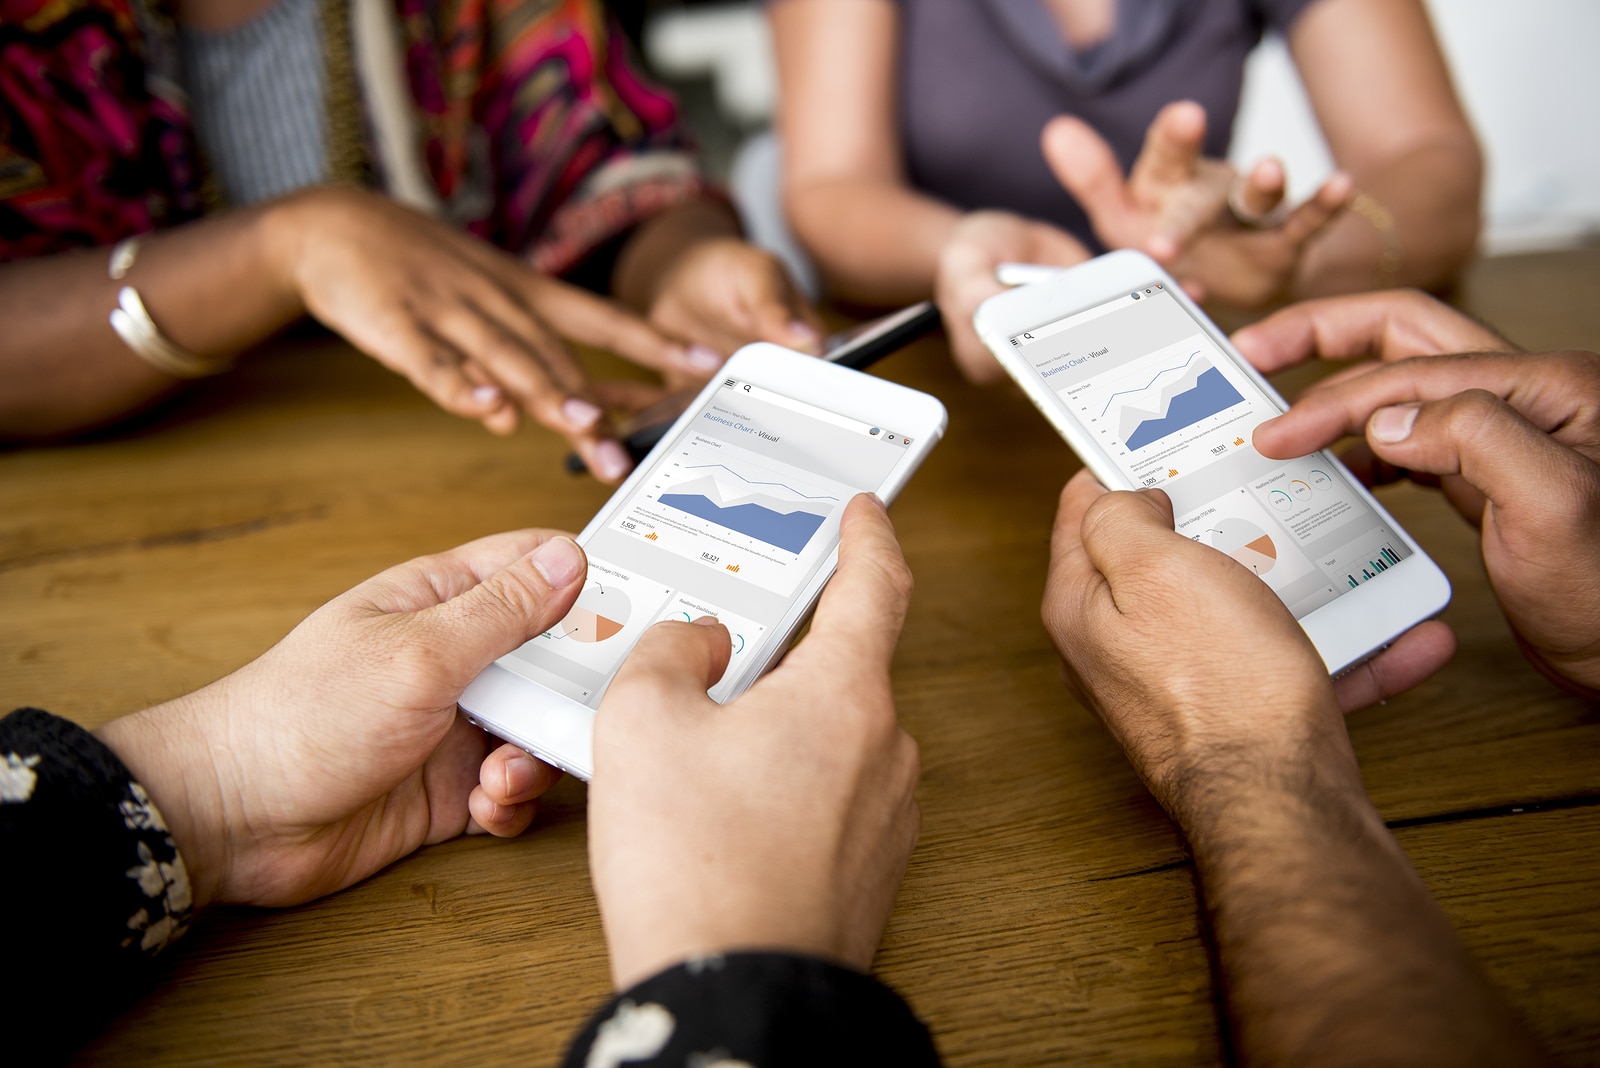
 However, the modern consumer’s increasing dependence on mobile apps opens up a solution for CPG brands in need of immediate insight on existing marketing campaigns. Data from shopping and retail apps can be used to gather real-time information on consumer buying behaviors that can, in turn, help to inform CPG companies on marketing decisions.
Shopping apps offer a benefit that other sources of data collection don’t: the ability to travel with the consumer throughout the buyer’s journey, from awareness to purchase. Consumer purchase behavior data can be used to strategize marketing campaigns for digital as well as brick and mortar locations that consumer packaged goods are sold in. It can even be used to gather customer feedback on new products within a limited launch market before they’re rolled out into the aisles nation-wide, or even worldwide.
By incorporating timely consumer data into their marketing and advertising decisions, CPG brands can better understand why consumers buy their products and when—and use that knowledge to stretch advertising dollars while increasing profits.
CPG Retail Analytics: Gaining Deeper Insight with Big Data
In the past, CPG retail analytics was focused on the supply chain. Brands would use the number of orders they received from specific retailers to understand where their products sold best, during which times of the year, and to whom based on the demographics of the neighborhood where the products were sold. This collection of historical data involved a specific category of analytics called Descriptive Analytics.
Big data and advances in technology have since introduced the ability to collect data in the moment, rather than just relying on historical sales information. This has led to the creation of several new categories of analytics that give more timely insight on specific consumer behavior:
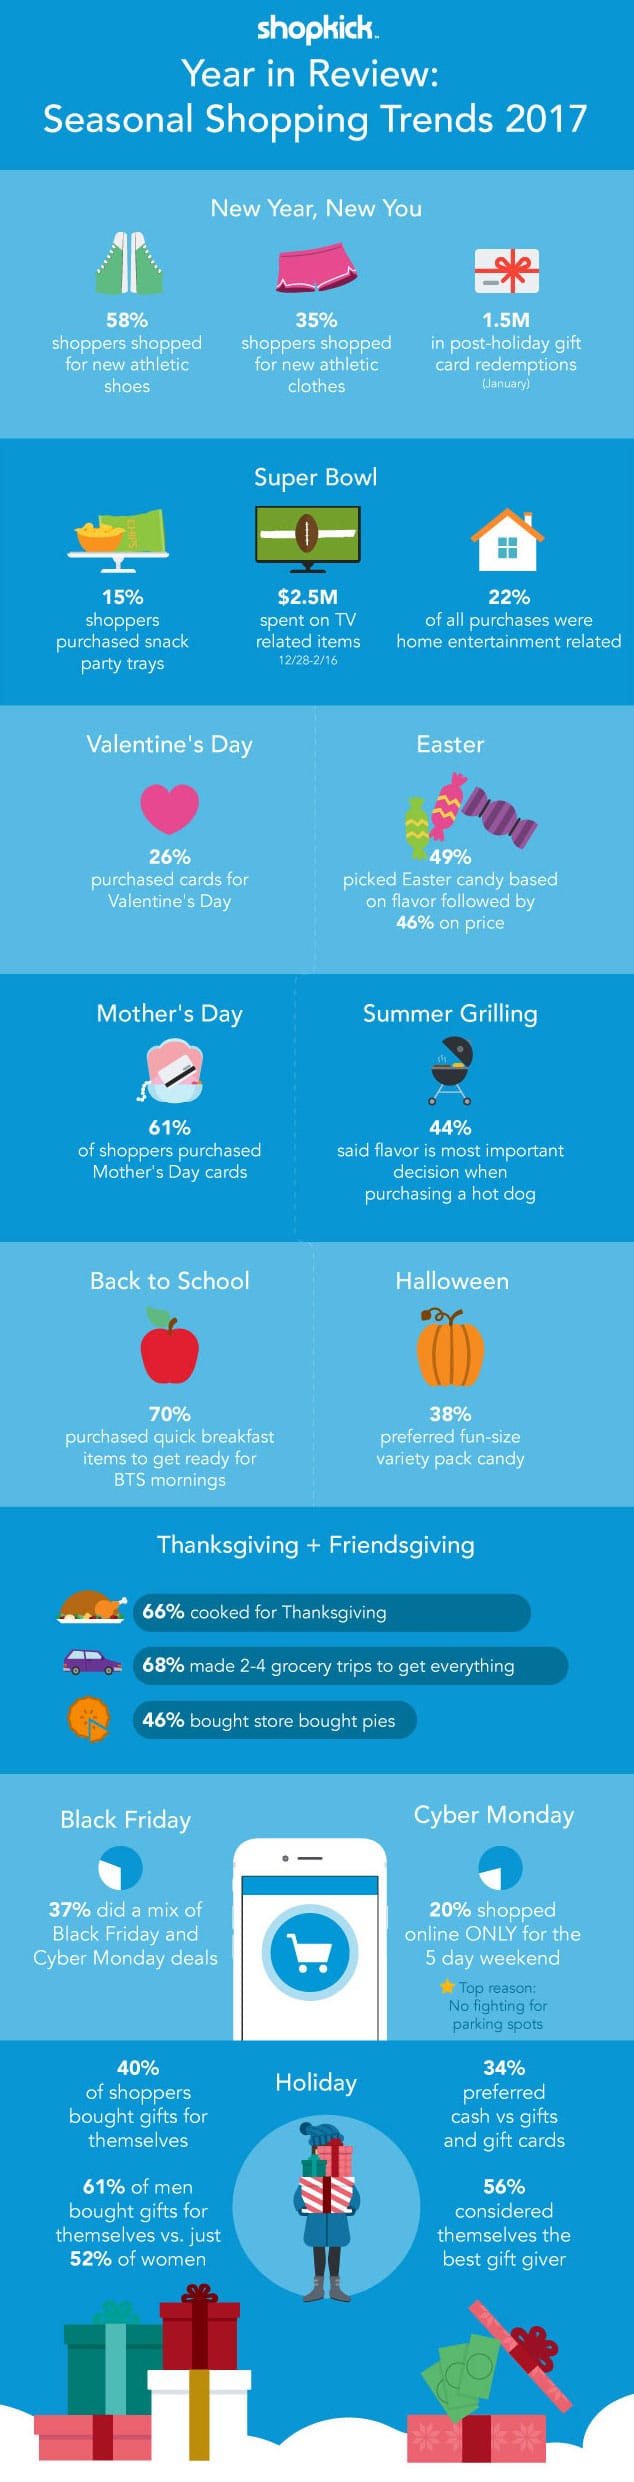
- Diagnostic Analytics: Descriptive Analytics involves gathering historical data. Diagnostic Analytics, on the other hand, looks specifically at the whys behind that data. A simple explanation of this is a grocery store that sees a sudden jump in nutmeg sales in November. If the store investigates this jump, they may notice that these purchases were often made in conjunction with canned pumpkin, ready-made pie crusts, and brown sugar. Using Diagnostic Analytics, the store can reasonably assume that customers are buying more nutmeg in November because they are making pumpkin pies for the holidays.
- Predictive Analytics: Predictive Analytics takes historical data and Diagnostic Analytics a step further. For instance, continuing with the above example, the company would take the past Diagnostic and Descriptive analytics into consideration to predetermine when the sale of nutmeg will peak—and when it will drop.
- Prescriptive Analytics: Prescriptive Analytics involves acting on the Predictive Analytics by evaluating several scenarios to determine the best way to capitalize on the known data. So, in the nutmeg example, the store could choose to increase its supply of nutmeg, raise the price of nutmeg, or release a new line of pumpkin pie seasoning that includes nutmeg during its peak buying months.
A similar theme among all these categories of analytics is that they require making certain assumptions based on existing consumer behavior. Big data makes it possible to use prior sales history to speculate about the future of sales based on the law of large numbers. The law of large numbers implies that the more data we have available, the more accurate predictions made about an outcome are likely to be. This is why consumer mobile shopping apps offer such a great opportunity for gaining insight on retail analytics for CPG brands.
Using Consumer Shopping Apps to Gain Better Analytical Insights
Signals of purchase intent provide a digital map of a consumer’s journey. They might see an ad on Facebook, follow that ad to the company’s website, read information on a landing page, then add a product to their shopping cart. They may then abandon the shopping cart without making a purchase. By pinpointing this exact moment where purchases are commonly abandoned, brands can find stumbling blocks in their purchase path and remove or resolve them.
This approach can be applied both in the digital and the brick and mortar environment by using innovative retail mobile apps, like shopping apps. Shopping apps incentivize consumer use by providing rewards for interacting with brands. One such app, Shopkick, uses this strategy to provide valuable data to its clients. Via Shopkick, or similar apps, brands can discover trouble spots that might be impairing the consumer’s path to purchase.
- Geo-tracking info: Geo-tracking information from a consumer app can alert brands to the most popular cities or regions where consumers purchase from them, as well as the least popular. Brands can use this data to discover area-specific anomalies in order to better control and distribute supply. For example, let’s say a brand sells mosquito repellant and sees a sudden spike in purchases in February at airport gift shops in Florida. This might tell the brand that there’s a demand, specific to the area, which they should prepare for. By gaining this insight via real-time retail mobile apps, the brand can gain awareness of this spike as it occurs.
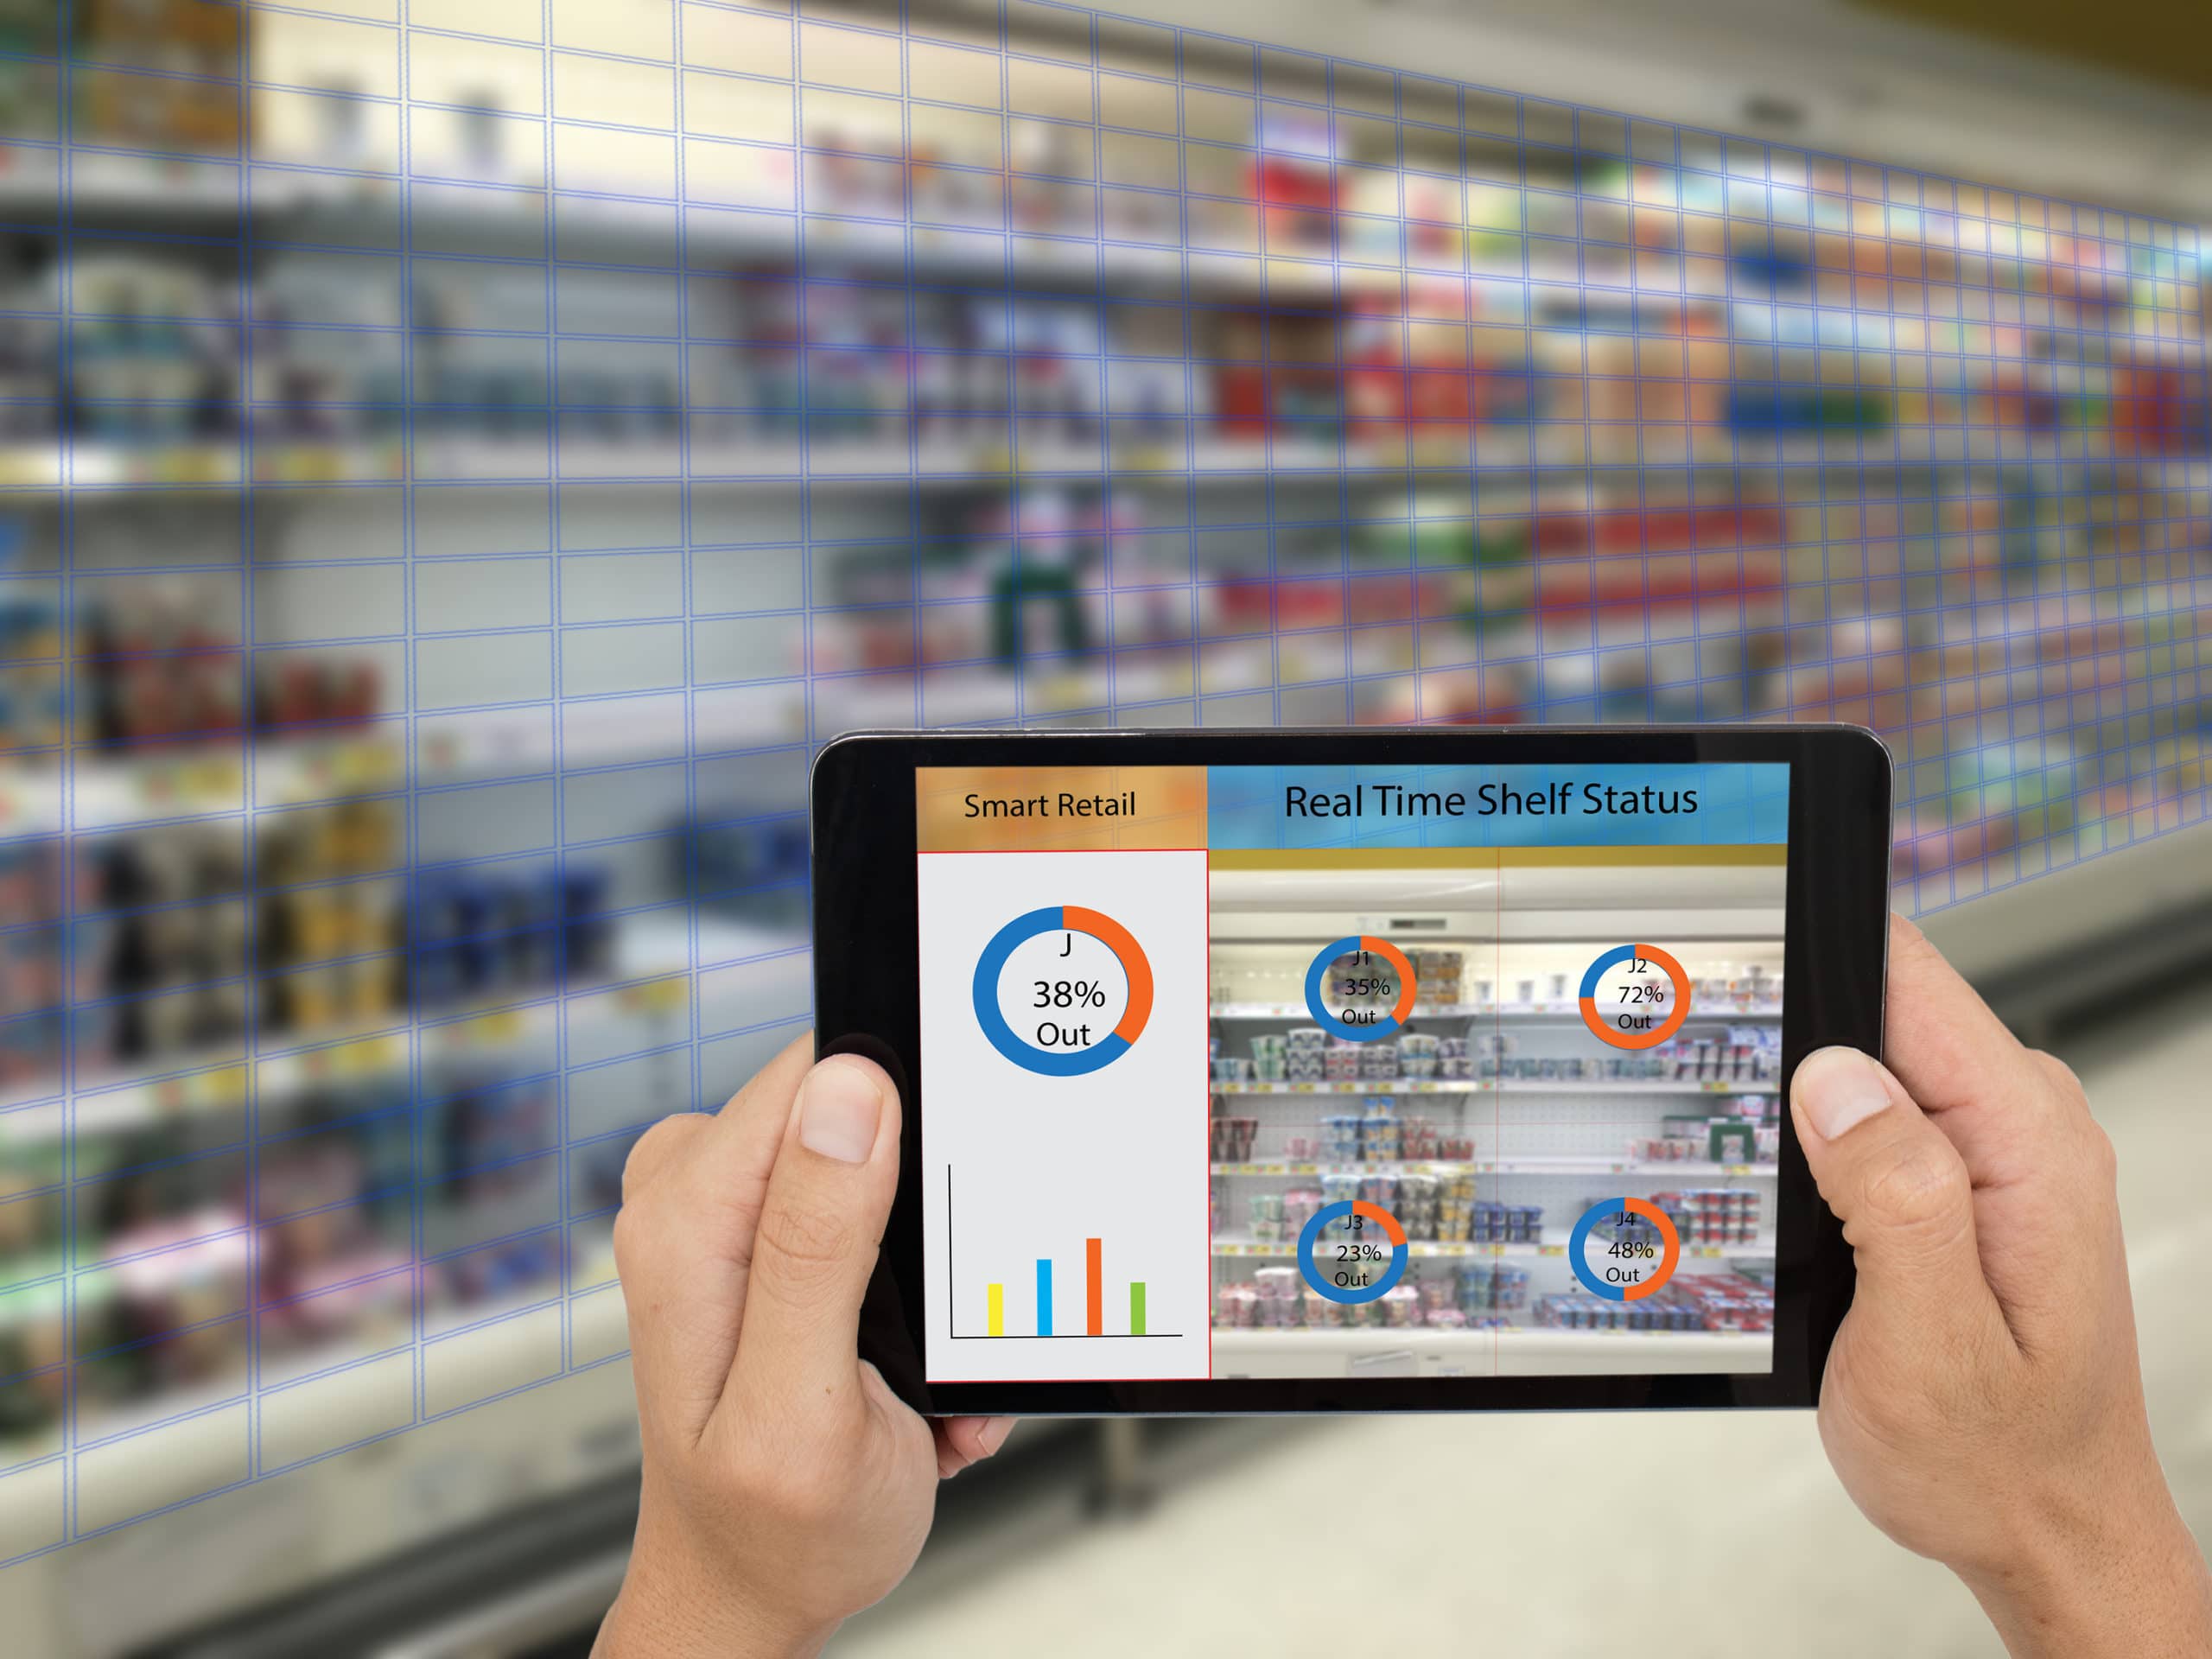
- In-store product visibility: Shopkick, as an example, offers consumers rewards in the form of points (called kicks) for finding and scanning products while they’re in the shopping aisle. However, if consumers find it too difficult to locate these products, they likely won’t make the effort to seek them out and scan them. A low number of scans may tell a brand that they need to reconsider their product placement in-store.
- Marketing message impact: Shopping apps allow brands to share their marketing messages with consumers via video advertising. The watching, or not watching, of these ads, can speak volumes. If consumers navigate away before the end of a video, or before the message even starts, there could be a technical problem that’s preventing them from viewing it. Or, there could be a disconnect between the audience and the brand’s message. Either way, a rapid abandonment rate could indicate the ad needs to be reevaluated as it may be generating a negative ROI. However, if the average consumer is taking the time to view the full ad, then seek out the brand and its products, it’s a good sign the message is making an impact.
Consumer retail apps offer brands real-time data that they can use to inform greater marketing decisions. This is especially useful when it comes from shopping apps where the most dedicated shoppers tend to congregate. Use of a shopping app shows a consumer researches brands more frequently—and plans out shopping trips more thoroughly—than the average consumer.
The insights gained from retail mobile apps, along with other big data, can help brands better understand their audiences and offer a smarter, faster way to target the right consumers effectively. When CPG companies can effectively analyze and predict behavior, they can successfully align marketing campaigns with their target audience. With the right insights, brands can more effectively use their marketing budgets to grow their consumer base—and their profits.
Shopkick provides a shopping app that our partners can use to drive shopper behavior and better understand their customers. For more information, contact our team today.
Image courtesy ekkasit919


![[Infographic]: Seasonal Shopping Trends 2017](https://www.shopkick.com/wp-content/uploads/2017/08/alcohol-advertising.jpg)